
It's Day 8 of the #30DayChartChallenge, and the prompt is "Histogram" 
 Another #RStats + Observable combination
 Kept it simple, but figured out more about small multiples (facets), sorting categories, and colour palettes in Observable today!


It's Day 8 of the #30DayChartChallenge, and the prompt is "Histogram"
Another #RStats + Observable combination Kept it simple, but figured out more about small multiples (facets), sorting categories, and colour palettes in Observable today!
It's Day 7 of the #30DayChartChallenge, and the prompt is "Outliers"
Data wrangling in #RStats Scatter plot made with Observable Static tooltips for annotations (+ dynamic tooltips for exploring)

For Day 3 of the #30DayChartChallenge, the prompt is "Circular"
 Sunburst plot showing countries where 1% have >10% of wealth Data formatting #RStats to create JSON data
 Figured out how to edit an imported D3 chart in Observable

Quarto + #RStats + Observable =
New blog post from me about:
 What is Observable?
 Why should R users care? How do you use both together to make interactive charts?
It's Day 1 of the #30DayChartChallenge, and the prompt is "Fractions"
 Data from Our World in Data on wealth distribution Data wrangling in #RStats
 Waffle plot made with Observable

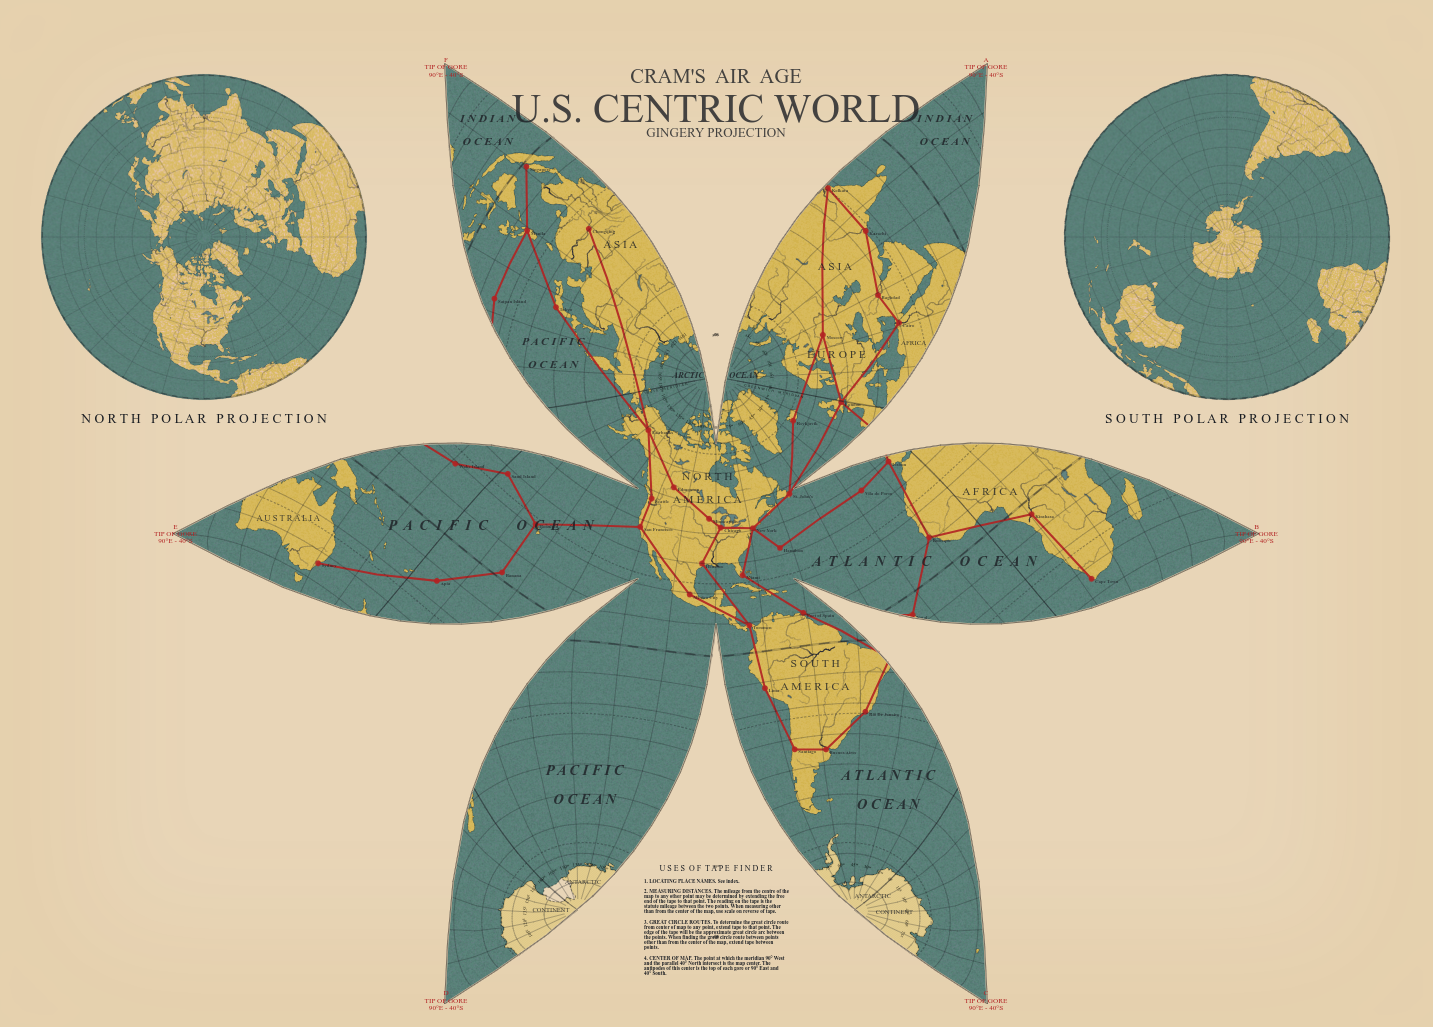
Another masterpiece from @jwolondon His #30DayMapChallenge 2024 is absolutely incredible. Very inspiring. #Observable #JavaScript #VintageCartography https://observablehq.com/@jwolondon/td
Analysis of Overture Maps POI quality by Wille Marcel (Aug 2023)
pyobsplot 0.5.1 is out.
pyobsplot is a #Python package allowing to use #Observable Plot to create #Jupyter widgets or static plots directly from Python with a syntax as close as possible to the JavaScript one.
This release improves performance of Plot.plot() and allows the Plot.mark().plot() shortcut syntax.
Over the weekend I implemented a number of charts and graphs looking into the data contributed by Better Intersections volunteers.
I wrote them up using Observable Plots and a lot of caching to prevent an avalanche of requests to Overpass Turbo.
All data and code is open source, PRs welcome!
https://jakecoppinger.com/2024/07/preliminary-analysis-of-better-intersections-data/
Being able to get `mgcv::gam` into JS/Observable via #RStats {webr} is just the bees knees.
#Observable Plot just has basic linear regression (it's nowhere near as robust as `geom_smooth()`), and it's almost zero effort to slide in fit data from other models thanks to the work of George & team.

"How to Work with Observable as a Geographer" is an interactive notebook that outlines different concepts and techniques for visualizing data #observable
https://observablehq.com/collection/@neocartocnrs/observable-cest-quoi
the integrations via the data loaders and the sql facilities of #observable framework are awesome and I haven't even played with everything yet...
For day 6 (OECD) of #30DayChartChallenge I tapped into their database of "trust in the national government" via #RStats #WebR in #Observable.
Unsurprisingly,  trust is in the
  .
.
Now I gotta dig in a bit more to know why Luxembourg is #1.
https://observablehq.com/@hrbrmstr/2024-30-day-chart-challenge-day-06-oecd

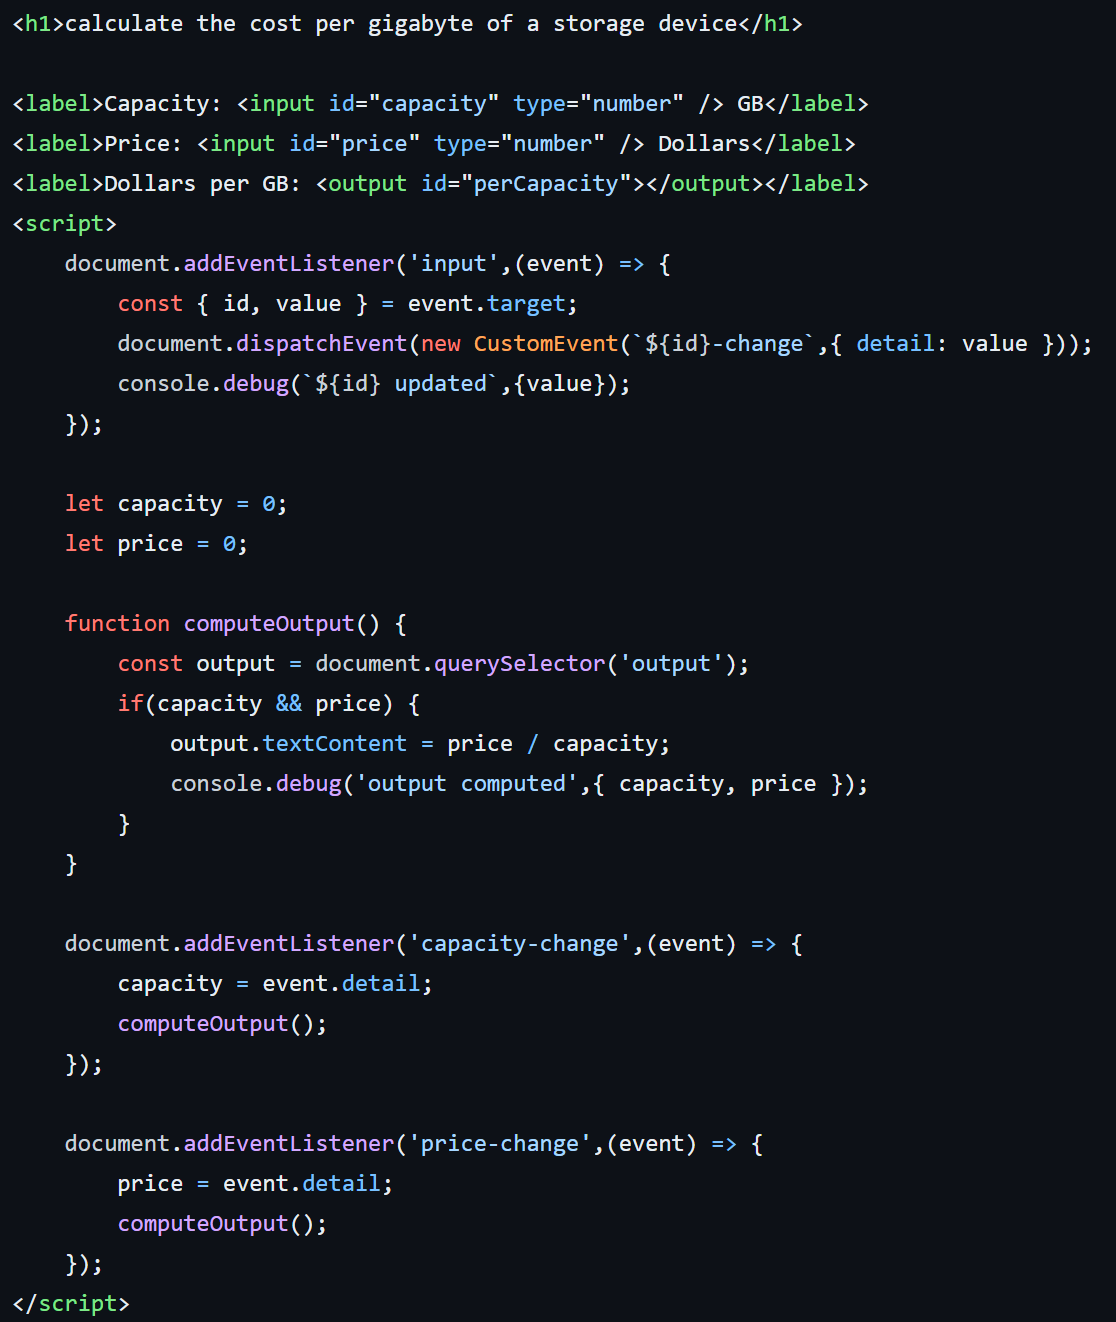
I built this POC to demonstrate how I'd use CustomEvents to implement Signals. Please criticize my approach and tell me why I need a native browser API for this.
so I've been playing with #observable framework a bit which is plot.js based and I kind of feel I've done better with "naked" d3.js I'm not even sure what precisely feels unwieldy or why I get really odd visual bugs..
playing with #observable framework (D3.js, Plot.js) and I still really like #javascript :)
Wait wait wait, now I’m finally getting around to learning #Streamlit, and that week #Observable drops #ObservableFramework as a neat new way to generating data-driven dashboards? 
observabable 2.0 now basically with static site generator "but with data" https://news.ycombinator.com/item?id=39383386 #d3 #observable